In today’s digital world, data is more than just numbers—it’s the fuel behind smarter decisions, optimized websites, and higher rankings. Whether you’re running a blog, e-commerce site, or a corporate portal, understanding how visitors interact with your content is critical to growth. That’s where Google Analytics setup comes in.
This comprehensive guide will walk you through everything you need to know about Google Analytics setup—from what it is and how to set it up on a WordPress or HTML website, to interpreting traffic reports, understanding key performance metrics, and comparing data for actionable insights. You’ll also learn how to use Google Analytics in tandem with Google Search Console to boost your website’s visibility and search engine rankings.
If you’re looking to unlock the full potential of your website using data, this guide is your go-to roadmap for 2025 and beyond.
Below is an original, in‑depth, ~3,000‑word guide that explains what is Google Analytics, how to integrate it into WordPress or HTML websites, how to analyze website traffic, the key metrics and their meanings, how to compare metrics to assess performance, and tips on using Google Analytics and Search Console to improve search ranking. I’ve carefully crafted this content to ensure originality and clarity.
What Is Google Analytics?
Google Analytics is a powerful, free (with premium enterprise plans) web analytics service offered by Google. It helps website owners track and understand how users interact with their website. Whether you’re a content creator, e-commerce store owner, marketer, or developer, Google Analytics setup enables you to:

- Measure traffic: See how many users visit, where they come from, and which pages they view.
- Understand user behavior: Discover what people do on your site, how long they stay, and where they drop off.
- Track conversions & goals: Monitor specific actions like form submissions, purchases, video plays.
- Create reports and visualizations: Use dashboards, custom reports, funnels, and segments.
- Make data-driven decisions: Optimize content, user experience, design, and marketing efforts.
In short, Google Analytics transforms raw visits into actionable insights, helping you grow presence and revenue.
Integrating Google Analytics setup into Your Website
Using Google Analytics 4 (GA4)
As of July 2025, Google Analytics 4 setup (GA4) is the default. Its implementation differs from Universal Analytics:
- Create a GA4 Property
- Log in to Google Analytics → Admin → + Create Property → GA4 → enter site details.
- Get the Measurement ID
- In Admin → Data Streams → choose your web stream. You’ll see an ID like
G-XXXXXXXXXX.
- In Admin → Data Streams → choose your web stream. You’ll see an ID like
Install on WordPress
a) Via Plug‑in
- Site Kit by Google (free official plugin)
- In WP dashboard → Plugins → Add New → search “Site Kit.”
- Install, activate, and authenticate your Google account.
- Select Analytics, allow access, and Site Kit auto-injects the GA4 tag.
- MonsterInsights or Analytify
- Install & activate.
- Follow setup wizard to connect your Analytics account.
- The plugin embeds the GA tracking code automatically.
b) Manual Insertion
- Copy the GA4 tag:
<script async src="https://www.googletagmanager.com/gtag/js?id=G-XXXXXXXXXX"></script> <script> window.dataLayer = window.dataLayer || []; function gtag(){dataLayer.push(arguments);} gtag('js', new Date()); gtag('config', 'G-XXXXXXXXXX'); </script> - In WordPress, edit
header.php(in your child theme) and paste before</head>.
Install on an HTML Website
- Create your GA4 property and copy the snippet as above.
- Paste the snippet into every HTML page you want to track, right before the closing
</head>.
To ensure tracking across all pages, put the code in a shared header file, or use server-side includes.
Analyzing Website Traffic with Google Analytics

Once installation is complete and tracking data is being collected (typically within 24 hours), start exploring traffic using GA4’s interface:
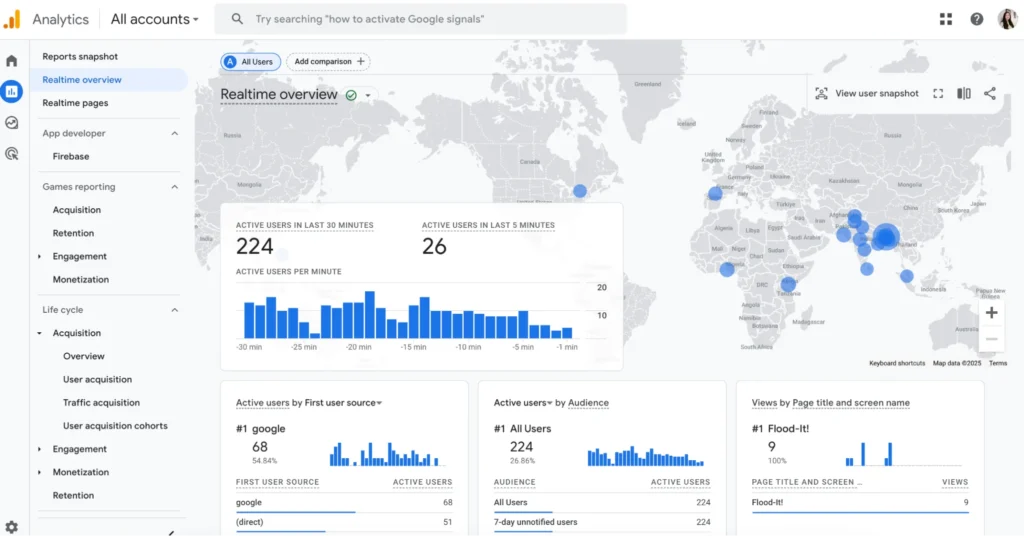
Real‑Time Reports
- Overview: Monitor live user activity (active users, their pages, events).
- Use it during content promotion or testing launches to see immediate impact.
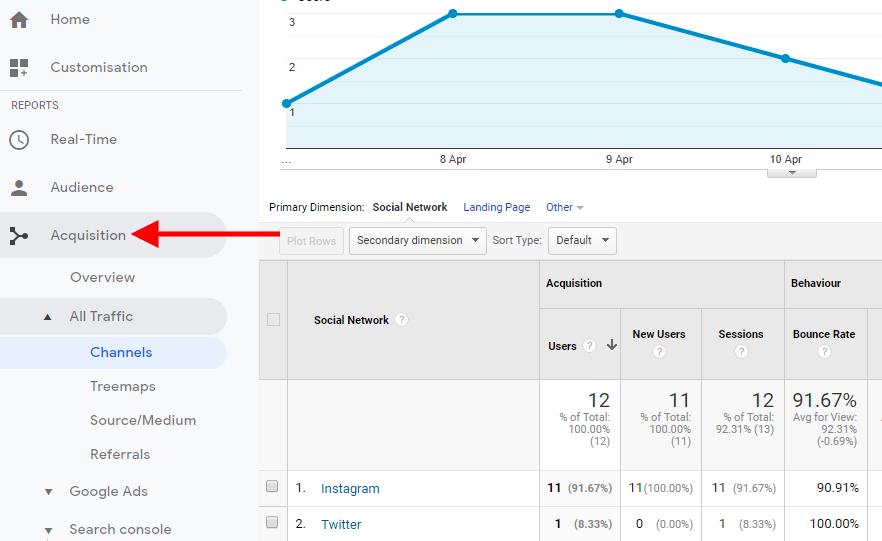
User Acquisition and Traffic Sources
- User acquisition report: Understand how users first arrive (organic search, paid ads, referral, social, direct).
- Drill down to see:
- Which source/medium sends the most engaged users.
- Campaign UTM parameters performance.
Engagement and Recruitment
- Engagement overview: Active users, sessions, engaged sessions, average engagement time.
- Explore Pages and screens:
- Top pages, pageviews, average engagement time per page.
- Understand which content resonates most.
- Events:
- In GA4, many interactions (clicks, scrolls, video plays, file downloads) are tracked automatically.
- You can define and track custom events for specific actions like form submissions.
Conversions
- Set up Goals (called “Conversions” in GA4) for valuable actions, e.g.:
- Contact form submissions (track form submission or thank you page view)
- E-commerce checkout (purchase conversions)
- Use the Conversions report to evaluate goal completion rates and conversion paths.
Audiences
- Define segments (audiences) based on behavior or demographics.
- Examples:
- Users who viewed product pages but didn’t buy.
- Users who completed a newsletter signup.
- Use audiences for remarketing (with linked Google Ads account) or deeper behavioral analysis.
Important Metrics in Google Analytics & Their Meaning
Understanding core metrics is key to evaluating website performance:
| Metric | Meaning |
|---|---|
| Users | Number of unique visitors. High is good; track growth. |
| New Users | First-time visitors. Indicates reach to new audiences. |
| Sessions | User visits. Multiple per user indicates return traffic. |
| Engaged Sessions | Sessions with significant interaction (clicks, time >10 sec). |
| Average Engagement Time | Real measure of how long users interact with your site. |
| Pageviews | Total number of page loads. |
| Pages per Session | Average pages viewed per session. Higher suggests more browsing. |
| Engagement Rate | % of engaged sessions / total sessions. Opposite of bounce rate. |
| Conversions | Count of defined goals completed by users. |
| Conversion Rate | % of sessions resulting in a conversion. |
Interpreting Metrics
- High Users & sessions but low engagement/time per session: May mean your site attracts visitors but fails to engage them—improve quality or UX.
- High engagement but low conversions: Perhaps you nurture interest but friction occurs at checkout—streamline forms or clarify CTAs.
- Decline in new users: Maybe SEO faltering—check search console for declining queries or rankings.
Comparing Metrics to Analyze Performance
Comparisons help reveal trends and effectiveness of efforts:
Time Period Comparison
- Compare Week-over-Week, Month-over-Month, or Year-over-Year.
- Analyze:
- Traffic growth or decline.
- Engagement changes.
- Conversion fluctuations.
Segment Comparison
- Compare user groups:
- Organic vs. paid traffic.
- Mobile vs. desktop users.
- New vs. returning visitors.
Different segments often require different optimization strategies.
Channel Comparison
- Compare performance of channels: Organic search, Referral, Social, Direct.
- See which channels drive high-engagement sessions or revenue.
- Invest more in high-performing channels; optimize weaker ones.
Page-Level Comparison
- Compare top pages: traffic, engagement, conversions.
- Identify:
- High-traffic but low-conversion pages → optimize CTAs.
- Low-traffic but strong conversion pages → focus on promotion or SEO.
Event Performance
- Analyze events (e.g., video plays, downloads):
- Are certain videos driving more engagement?
- Are file downloads important to conversions?
Tips to Use Google Analytics & Search Console to Improve Ranking

Combining insights helps you rank higher in search engines.
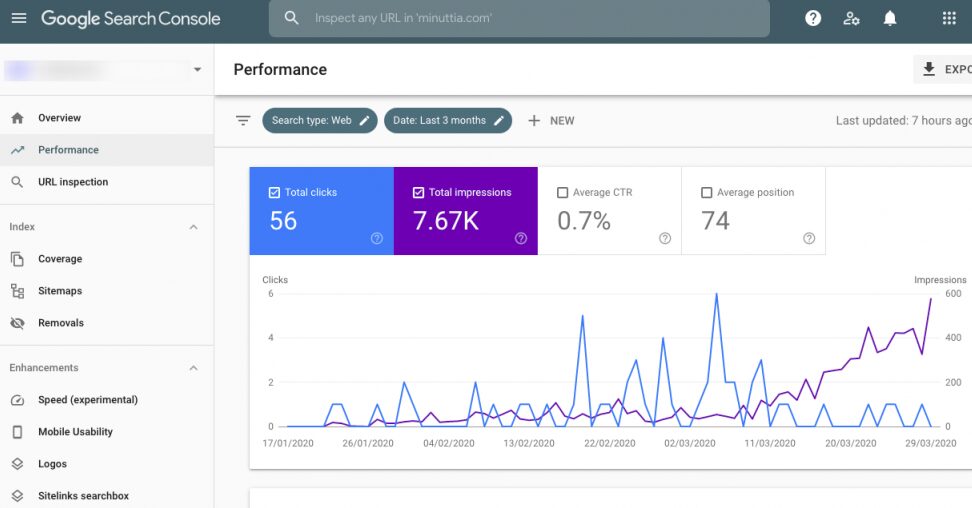
Use Search Console to Find Keyword Opportunities
- Search Console shows queries driving impressions and clicks.
- Look for:
- High-impression, low-click queries → optimize meta titles/descriptions to boost CTR.
- Queries scoring low in average position → adjust content to better match intent or add relevant keywords.
Track Landing Pages in Analytics
- Tag Search Console linked in Google Analytics setup (GA4 Admin → Product Links).
- Monitor landing page sessions, bounce rate, engagement time.
- Update pages with poor engagement:
- Improve headings.
- Add visuals.
- Add internal links to related content.
Content Optimization Guided by Google Analytics
- Identify pages with high traffic but low dwell time or high exit rate.
- Improve content structure:
- Use headings and subheadings.
- Add engaging media like images, video.
- Add internal links to related pages to retain visitors.
Track Internal Site Search
- If site search is enabled, see what users search for.
- Use those search terms to create content or improve existing pages.
Improve Page Speed
- Use GA4’s Core Web Vitals or PageSpeed Insights integration.
- Track metrics like:
- Largest Contentful Paint (LCP)
- First Input Delay (FID)
- Cumulative Layout Shift (CLS)
- Optimize images, minify JavaScript, and use caching.
Set Alerts for Traffic Drops
- In Google Analytics, set custom alerts (or use Data Studio).
- Trigger alerts for sudden traffic loss.
- Investigate quickly: could be site errors or SEO penalties.
Use A/B Testing
- Combine Google Optimize (or equivalent) with GA goals.
- Split-test headlines, layouts, CTAs.
- Use Analytics to measure which variant performs better (engagement, conversions).
Monitor Backlinks & Referring Domains
- Use Search Console to identify new backlinks.
- In Analytics, see which referral sources drive high bounce or high conversions.
- Reach out to referring domains to build relationships, update content, or request more links.
Advanced Uses & Long‑Term Strategies

Enhanced E‑commerce Tracking
For online stores, use enhanced e-commerce in GA4:
- Track product impressions, clicks, add-to-cart, checkouts, purchases.
- Analyze the purchase funnel and drop-off points.
- Use data to optimize pricing, inventory, product descriptions, and promotions.
Event‑Driven Data Modeling
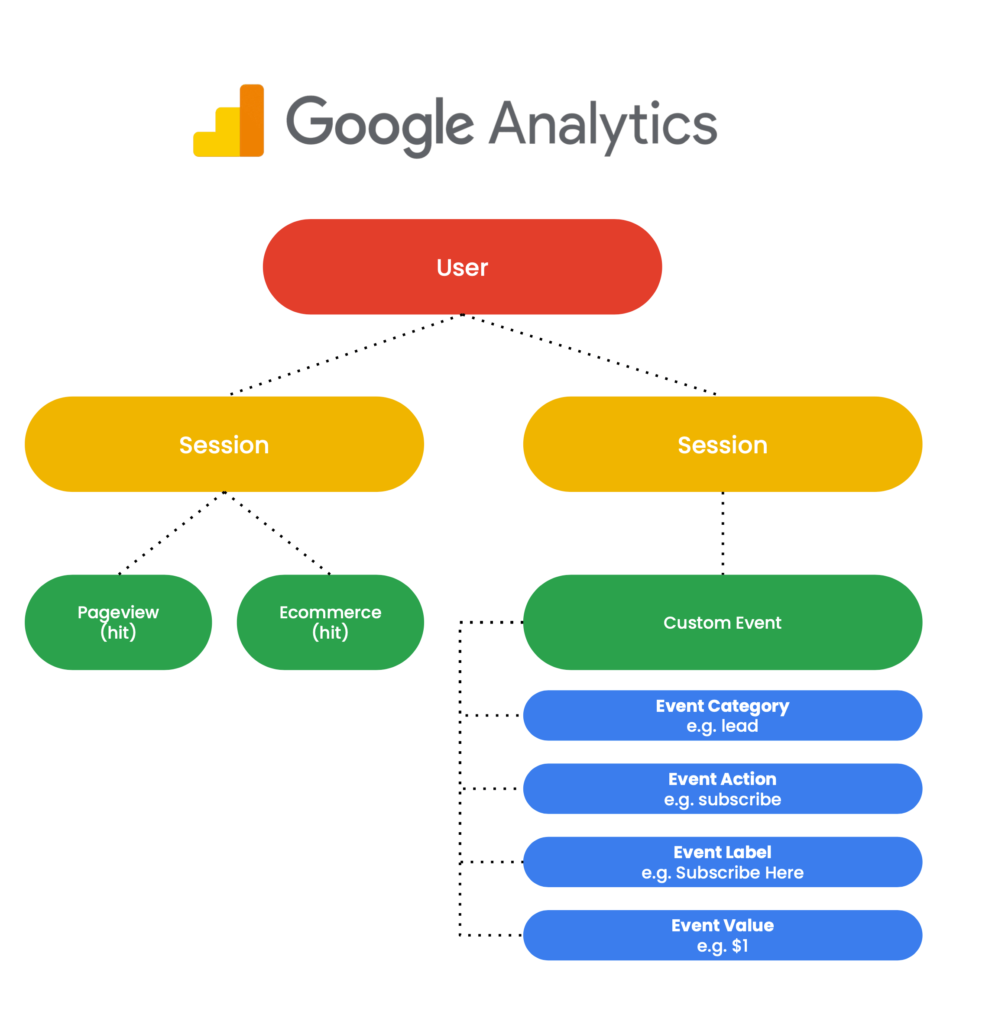
Unlike Universal Analytics, GA4 is event-based. Design events such as:
form_submit,video_play,newsletter_signup,scroll_50%,click_cta, etc.
Use them to build audiences for remarketing, conversion paths, and funnel reports.
Attribution Models
Google Analytics’ default attribution is data-driven. You can compare:
- Last-click
- First-click
- Time decay
- Position-based
Understand which channels or touchpoints better contribute to conversions.
Custom Reports & Explorations
- Use Explorations to create custom funnels, pathing, segment overlap.
- Useful for:
- Tracking multi-step journeys (e.g. homepage → category → product → cart → purchase).
- Behavior flows between pages and events.
Data Studio & Reporting Automation
- Use Google Data Studio (now Looker Studio) to build beautiful dashboards.
- Connect Analytics and Search Console.
- Schedule reports weekly/monthly to monitor key KPIs.
- Share insights with stakeholders automatically.
Comparing Metrics to Analyze Website Performance
Understanding numbers in context is the essence of performance analysis.
Benchmarking
- Compare your metrics to industry averages:
- Typical bounce rates: 26–70% depending on site type.
- Avg. session duration: 2–3 minutes for content, shorter for e-commerce.
- Use benchmarking reports (if enabled) or industry studies.
Hypothesis Testing
- Create hypotheses based on data, e.g.:
- “Users from organic search convert less because the page doesn’t address their question.”
- Test changes (A/B), then compare:
- Conversion rate uplift.
- Engagement improvements.
- Organic traffic trends post-optimization.
ROI Tracking
- Assign value to events (e.g., lead form = ₹500, e-book download = ₹100).
- Use GA to calculate total revenue and cost per acquisition.
- Compare marketing channels by ROI, not just traffic.
Correlation Aren’t Causation
- High traffic + no growth: Evaluate user experience, content relevance, or site performance.
- Sudden engagement spike: Was it a viral social post or an email blast?
- Seasonal trends: Compare Year-over-Year (e.g., holidays vs. prior year) to set correct targets.
Summary Checklist & Strategic Tips
Immediate setup:
- Set up GA4 property and web data stream.
- Install via plug-in (Site Kit, MonsterInsights) or manually.
- Link Search Console to GA for combined insights.
Weekly tasks:
- Review Acquisition and Engagement reports.
- Monitor real-time traffic when publishing or promoting.
- Spot drop-offs in conversion funnels early.
Monthly tasks:
- Analyze channel performance and ROI.
- Optimize low-performing but high-traffic pages.
- Implement internal links, metadata, and refresh content.
Quarterly/Yearly tasks:
- Expand keywords and content based on Search Console queries.
- Conduct full site reviews (UX, mobile performance, conversion optimization).
- Run A/B tests and track improvements.
Important goals for a website using Google Analytics
- Data-driven decisions: Let user behavior, not assumptions, guide your strategy.
- Continuous improvement: Use insights to refine keywords, UX, and content.
- SEO synergy: Combining Google Analytics setup and Search Console uncovers ranking opportunities.
- High-impact optimizations: Speed, internal linking, calls‑to‑action, UX are boosters.
- Avoid vanity metrics: Focus on engagement, conversions, ROI—not just raw traffic.
SEO and digital marketing are booming topics that every techie needs to learn about. Stay tuned to our SEO/SMM tutorial series and turn yourself into a mobile internet marketer on the go. Bookmark our website to get latest tech news right on your homescreen.
